Nicht kategorisierte Dateien
Aus Unterrichtsmaterial
Unten werden bis zu 100 Ergebnisse im Bereich 71 bis 170 angezeigt.
Zeige (vorherige 100 | nächste 100) (20 | 50 | 100 | 250 | 500)
 37.png 554 × 625; 175 KB
 38.png 512 × 258; 94 KB
 39.png 502 × 300; 138 KB
 40.png 712 × 404; 121 KB
 41.png 764 × 735; 110 KB
 42.png 787 × 302; 47 KB
 5.png 943 × 449; 199 KB
 6.png 554 × 100; 33 KB
 7.png 347 × 293; 48 KB
 8.png 712 × 316; 140 KB
 9.png 356 × 300; 35 KB
 AB10 Systematik.docx ; 951 KB
- AB11 Evaluation.docx ; 244 KB
 AB1 - Vorlage.png 718 × 513; 25 KB
- AB1 Nährwerte als Daten.docx ; 68 KB
 AB2 - Vorlage.png 715 × 676; 46 KB
- AB2 Lebensmittel Label.docx ; 2,32 MB
- AB3 - Datenerhebung.docx ; 130 KB
- AB3 Schwellenwerte Anwenden.docx ; 1,78 MB
- AB4 - Personensteckbrief.docx ; 184 KB
- AB4 Schwellenwert Suchen.docx ; 1,9 MB
- AB5-A - Rollenspiel.docx ; 285 KB
- AB5-B - Rollenspiel.docx ; 286 KB
- AB5-C - Rollenspiel.docx ; 286 KB
- AB5-D - Rollenspiel.docx ; 286 KB
- AB5-E - Rollenspiel.docx ; 286 KB
- AB5 - Plakat.docx ; 289 KB
- AB5b - Plakat.docx ; 289 KB
- AB5c-A - Talkshow.docx ; 285 KB
- AB5c-B - Talkshow.docx ; 286 KB
- AB5c-C - Talkshow.docx ; 284 KB
- AB5c-D - Talkshow.docx ; 285 KB
- AB5c-E - Talkshow.docx ; 284 KB
- AB6 Zweiter Datensplit.docx ; 97 KB
- AB8 Blankokarten.docx ; 273 KB
 AB Bilderkennung.pdf 0 × 0; 625 KB
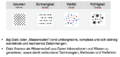 Abb12 Begriffsklärung.png 688 × 327; 52 KB
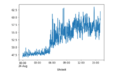 Abbildung 10- Zusammenfassung der Lärmdaten pro Minute.png 401 × 250; 27 KB
 Abbildung 13- Arbeitsauftrag zu Google Trends Explorationen.png 645 × 466; 18 KB
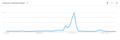 Abbildung 14- Grafik zum Suchbegriff Libori bei GoogleTrends.png 1.152 × 384; 18 KB
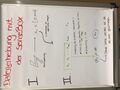 Abbildung 17- Erklärung der Datenerhebung mit der SenseBox.jpg 875 × 656; 93 KB
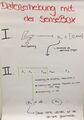 Abbildung 17- Erklärung der Datenerhebung mit der SenseBox .jpg 566 × 808; 86 KB
 Abbildung 19- Steckbrief des Standorts A.png 826 × 1.169; 58 KB
 Abbildung 20- Arbeitsauftrag zur Datenanalyse im Lärmprojekt.png 889 × 427; 43 KB
 Abbildung 24- Reflexion des ersten Bausteins.png 1.213 × 709; 101 KB
 Abbildung 3- Aufbau des im Projektkurs genutzten Messinstruments.png 1.385 × 325; 118 KB
 Abbildung 4- Aufbau eines Jupyter Notebooks.png 1.333 × 750; 165 KB
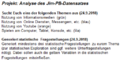
 Abbildung 5- Beschreibung des Lärmprojekts und der Lärmdaten.png 537 × 853; 181 KB
 Abbildung 6- Das Dateneinlesen im Jupyter Notebook.png 910 × 644; 175 KB
 Abbildung 7- Umrechnung des Zeitstempels.png 968 × 930; 127 KB
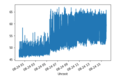 Abbildung 9- Darstellung der Lärmdaten für einen Tag.png 356 × 241; 18 KB
 Ablauf englisch.png 1.916 × 1.102; 61 KB
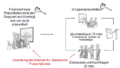
 Ablauf im Computer.png 2.002 × 1.412; 122 KB
 Ablaufdiagramm.png 1.866 × 1.093; 67 KB
 AblaufdiagrammWeiß.png 1.887 × 1.103; 90 KB
 AmandaWeber.PNG 1.408 × 790; 370 KB
- Anleitung CODAP umcodieren.docx ; 507 KB
- Anweisungskarten.docx ; 22 KB
- Arbeitsblatt.odt ; 7 KB
- Arbeitsblatt 1-5 - Instagram.pdf 0 × 0; 57 KB
- Arbeitsblatt 1 - Google Suche.pdf 0 × 0; 67 KB
- Arbeitsblatt 2 - Google Suche.pdf 0 × 0; 100 KB
- Arbeitsblatt 3 - Google Suche.pdf 0 × 0; 101 KB
- Arbeitsblatt 6 - Instagram.pdf 0 × 0; 36 KB
- Arbeitsblatt 7 - Instagram.pdf 0 × 0; 36 KB
 Arbeitsblatt zum Skizzieren von eigenen Lärmprofilen.png 1.065 × 747; 72 KB
- Arbeitsblatt zum Zuordnen der Verdächtigen.pdf 0 × 0; 280 KB
- Arbeitsblatt zur Bearbeitung der Hinweise.pdf 0 × 0; 254 KB
- Arbeitsblatt zur Bearbeitung der Hinweise Präsenz.pdf 0 × 0; 254 KB


_von_Samstag,_6.8.18_mit_einem_Sampling_auf_1_Minute.png)
_von_Donnerstag,_23.08.18_mit_einem_Sampling_auf_1_Minute.png)


.png)


Zeige (vorherige 100 | nächste 100) (20 | 50 | 100 | 250 | 500)